How to Use PGO and LTO With Meson and Clang
A tested walkthrough for enabling Profile Guided Optimization and Link Time Optimization in a Meson project built with Clang, including the llvm-profdata merge step most guides forget.
Measuring PGO and LTO on a C++ SPH simulation with perf and flamegraphs, and why they barely helped.
In part 1, I showed how compiler flags could drastically affect speed: 40x.
Everything that was optimized was done via static optimization, which is fine and sufficient for most cases.
But before diving into the code, can we extract some more performance?
What PGO does is quite simple: it runs your code with (software) performance counters. Calls to functions will be counted, and by doing so, the program will output a “summary” of how your code ran.
You should not push these builds to prod.
Your compiler (I use clang) will use that data to inline functions, guide branch layout, and split your hot/cold paths.
First things first, you need your build to be a PGO build. It’s quite simple, actually: just compile it with -fprofile-generate and you’re done.
If you use meson, the option is wrapped in -Db_pgo=generate
Build it first with meson:
meson setup build-pgo --buildtype=release -Dcpp_args="-march=native -ffast-math -funroll-loops -ffp-contract=fast -fno-stack-protector -DNDEBUG" -Db_pgo=generate
meson compile -C build-pgo
Then run it:
optim episode-2 ? ❯ ./build-pgo/sph 500 --headless 1500Reconfigure, and build with:
meson configure build-pgo -Db_pgo=use
meson compile -C build-pgo
It’s as shrimple as that.
Now that we have our binary with PGO, let’s run it:
PGO used:
headless: 500 particles, 1500 frames
frame    0 |    3.40 ms/step | rho avg 900.2 [513.1..1433.4] | max speed 1.44
frame   30 |    3.02 ms/step | rho avg 804.8 [223.7..1008.6] | max speed 3.92
frame   60 |    3.04 ms/step | rho avg 777.1 [207.1..1042.8] | max speed 2.19
frame   90 |    3.16 ms/step | rho avg 798.6 [197.9..1052.3] | max speed 2.12
frame  120 |    3.21 ms/step | rho avg 844.2 [195.8..1147.9] | max speed 2.42
frame  150 |    3.26 ms/step | rho avg 857.0 [195.8..1118.9] | max speed 3.16
// ...
frame 1320 |    3.43 ms/step | rho avg 882.2 [230.7..1087.6] | max speed 3.27
frame 1350 |    3.41 ms/step | rho avg 886.6 [223.8..1088.8] | max speed 2.28
frame 1380 |    3.43 ms/step | rho avg 890.8 [243.7..1082.2] | max speed 2.63
frame 1410 |    3.43 ms/step | rho avg 879.6 [350.5..1064.3] | max speed 3.62
frame 1440 |    3.41 ms/step | rho avg 892.3 [406.6..1082.1] | max speed 3.77
frame 1470 |    3.42 ms/step | rho avg 886.2 [368.0..1074.9] | max speed 2.37
frame 1499 |    3.43 ms/step | rho avg 883.8 [334.6..1088.3] | max speed 1.91
avg 3.45 ms/step over 1500 frames
And what about the non-PGO build?
headless: 500 particles, 1500 frames
frame    0 |    3.10 ms/step | rho avg 900.2 [513.1..1433.4] | max speed 1.44
frame   30 |    3.07 ms/step | rho avg 804.8 [223.7..1008.6] | max speed 3.92
frame   60 |    3.07 ms/step | rho avg 777.1 [207.1..1042.8] | max speed 2.19
frame   90 |    3.14 ms/step | rho avg 798.6 [197.9..1052.3] | max speed 2.12
frame  120 |    3.27 ms/step | rho avg 844.2 [195.8..1147.9] | max speed 2.42
frame  150 |    3.34 ms/step | rho avg 857.0 [195.8..1118.9] | max speed 3.16
// ...
frame 1320 |    3.44 ms/step | rho avg 887.1 [199.5..1122.8] | max speed 3.20
frame 1350 |    3.50 ms/step | rho avg 883.4 [233.8..1075.8] | max speed 2.16
frame 1380 |    3.57 ms/step | rho avg 889.9 [230.6..1078.1] | max speed 2.17
frame 1410 |    3.54 ms/step | rho avg 885.4 [197.7..1101.6] | max speed 3.95
frame 1440 |    3.42 ms/step | rho avg 890.3 [195.9..1092.9] | max speed 2.07
frame 1470 |    3.49 ms/step | rho avg 889.6 [203.3..1094.8] | max speed 1.92
frame 1499 |    3.50 ms/step | rho avg 898.0 [199.4..1098.1] | max speed 2.64
avg 3.46 ms/step over 1500 frames
Whoops. That’s underwhelming, to say the least.
Running it a few more times gives an average 3% performance boost, which is welcome, of course.
But why? 🐧
We are software engineers, and engineers at heart. Just “3% perf boost” doesn’t cut it.
We need to measure and understand why. And we have a tool for it: perf.
Let’s run it on the PGO-optimized build first:
perf stat -e branches,branch-misses ./sph 500 --headless 1000
avg 3.40 ms/step over 1000 frames

 Performance counter stats for './sph 500 --headless 1000':

     3,313,498,538      branches:u
        34,560,076      branch-misses:u

       3.406098485 seconds time elapsed

       3.393040000 seconds user
       0.000980000 seconds sys
Then the non-PGO:
Performance counter stats for './sph 500 --headless 1000':

     3,314,636,274      branches:u
        34,849,095      branch-misses:u

       3.454936810 seconds time elapsed

       3.431571000 seconds user
       0.001985000 seconds sys
So, as discussed earlier, it’s kind of disappointing. The change is minimal. 0.8% fewer misses.
But what does the flame graph say?
Non-PGO:
PGO: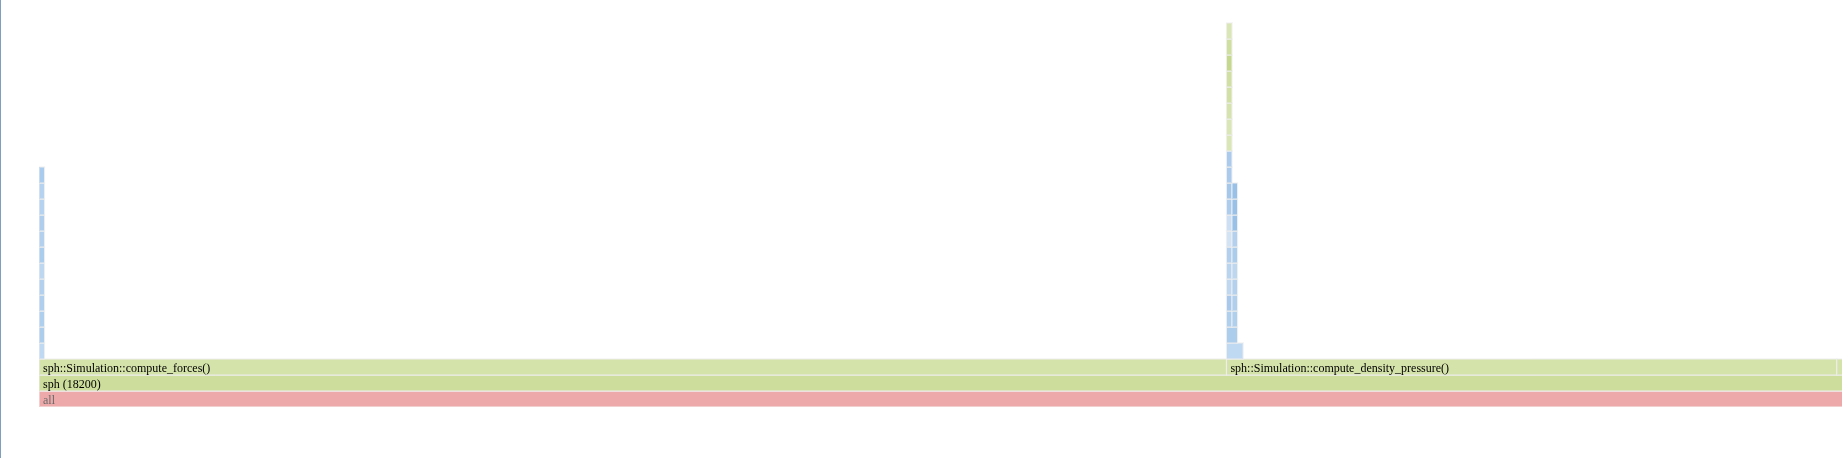
No changes, really.
LLVM’s Link Time Optimization is an optimization integrated within LLVM, and thus the Clang compiler.
The LLVM Link Time Optimizer provides complete transparency, while doing intermodular optimization, in the compiler tool chain. Its main goal is to let the developer take advantage of intermodular optimizations without making any significant changes to the developer’s makefiles or build system. This is achieved through tight integration with the linker. In this model, the linker treats LLVM bitcode files like native object files and allows mixing and matching among them. The linker uses libLTO, a shared object, to handle LLVM bitcode files. This tight integration between the linker and LLVM optimizer helps to do optimizations that are not possible in other models. The linker input allows the optimizer to avoid relying on conservative escape analysis.
Each symbol (let’s say a function) is defined within a module: for instance, math.c, gui.c, or main.c.
It’ll analyze each module and perform a number of optimizations, e.g. discarding unused symbols.
That’s why it’s a powerful beast when used with PGO: if the compiler knows a branch is never taken, it can discard the corresponding symbols and blocks, clearing the hot path.
Looking into my code, there is something to notice. It’s a simulation. Every bit that’s computed will be computed in a loop. You can’t optimize your branches if there are no branches to begin with.
It’s as simple as that.
On the other hand, modern CPUs are pretty efficient and smart.
First of all:
I suggest you take a look at Demystifying Intel Branch Predictors by Milena Milenkovic, Aleksandar Milenkovic, and Jeffrey Kulick.
While looking to optimize their CPUs, Intel, AMD, and other vendors figured out that shrinking silicon, adding instructions, and optimizing them wasn’t enough.
They needed to reduce the number of fetches. CPU instructions (your basic assembly building blocks) are fetched by the CPU and stored in the cache. Because the caches are not that large, CPUs will try to select only what’s needed. That’s where the branch predictor comes in.
Through speculative analysis, the CPU will determine which branches are the most used (your hot paths) and cache them, keeping them ready for the next iteration. It works amazingly well in loops.
In the end, PGO pre-optimizes something that the CPU already does (PGO build or not!) pretty well. That’s why we don’t squeeze out as much performance as we wished we would.
There is also the case of inlining (function bodies are embedded into their callers, dropping the need for an expensive call).
Finally, PGO will also help the compiler with hot/cold splitting. I suggest you have a look at this talk by Ruijie Fang from Princeton.
TL;DR: Some blocks of instructions are never used, some others are used frequently. By separating the most used blocks from the least used ones, your instruction cache will mostly be filled with instructions (blocks) from hot paths.
Simply: branch-heavy code.
Think about a virtual machine. The CPU can’t really analyze programs at that scale. But by running it yourself, you can predict the most used instructions, and when that instruction lands in an if, the “pop” branch (most likely, I’m making this up) will be the one the control flow takes most often.
There are other compiler features that could be used to improve performance. A real benchmark/profiling methodology could also be beneficial. Also, I didn’t explore this part, but you can inform the compiler of the branches most likely to be used with __builtin_expect.
But I want to dive into the code and optimize it myself: SIMD, Multithreading, SoA, AoS, and more.
A tested walkthrough for enabling Profile Guided Optimization and Link Time Optimization in a Meson project built with Clang, including the llvm-profdata merge step most guides forget.

Before touching a single line of my fluid simulation, I let the compiler do the work. Just changing flags got me from 1x to roughly 40x.

Multiboot2 drops you in 32-bit protected mode; Limine hands you a 64-bit environment. A single entry trampoline that handles both without forking the kernel.