
The baseline#
I wrote a simple SPH fluid simulation based on “Particle-Based Fluid Simulation for Interactive Applications” by Matthias Müller, David Charypar and Markus Gross.
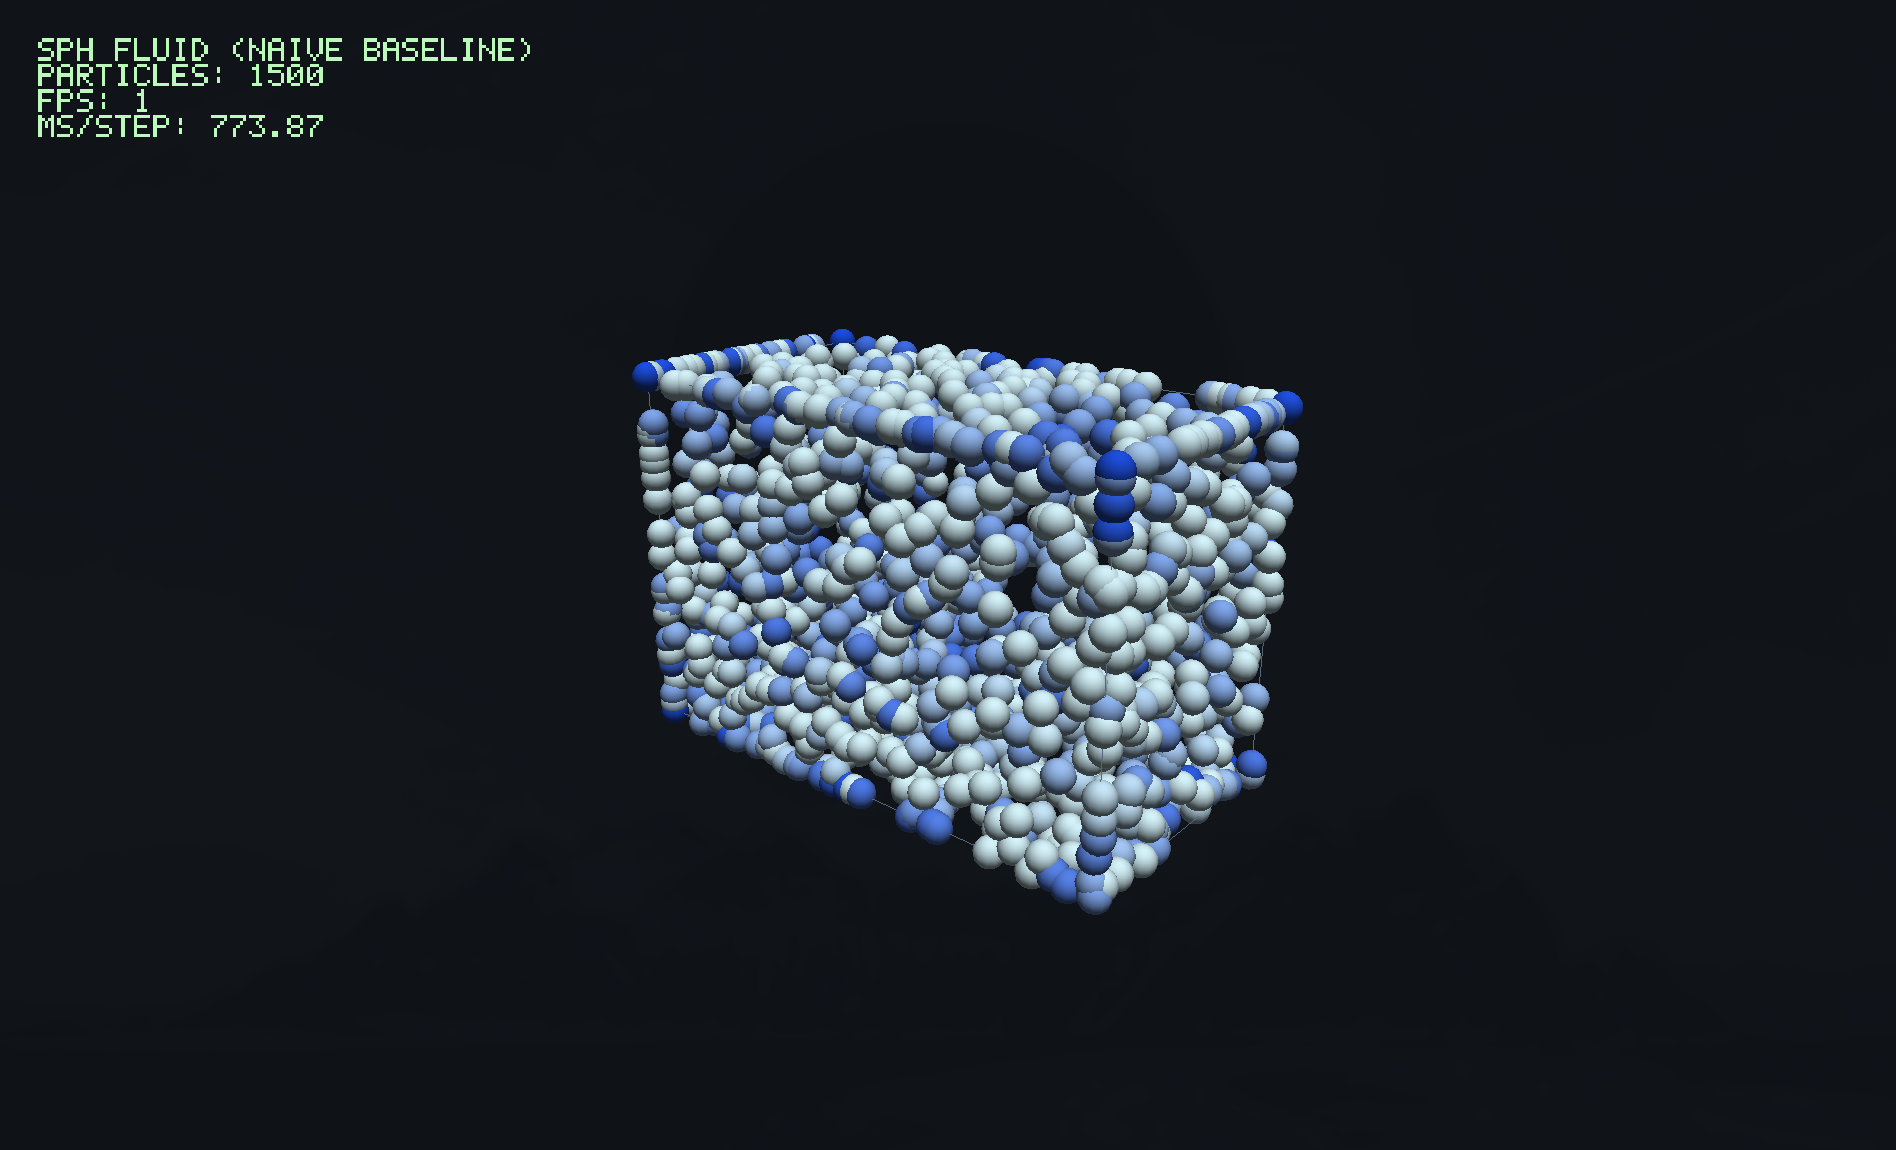
The project is unoptimized by default. C++20, std::vector everywhere, glm for the math, double precision, debug build.
It runs. It’s just painfully slow.
So I started wondering how much performance I could squeeze out of my machine (a ThinkPad P14s Gen 5 with an AMD Ryzen 8 PRO 8840HS) for this simulation. In this series I’ll go through the whole journey. This first part is about the cheapest win available: letting the compiler optimize my naive code before I rewrite any of it.
The -O flag#
Flags controlling how much optimization should be performed.
Behind that one little flag lives a huge amount of clang machinery. It eventually gets handed to LLVM’s PassBuilder, and if you peek at llvm::OptimizationLevel you get a pretty honest summary of each level:
- 0: disable as many optimizations as possible.
- 1: optimize quickly without destroying debuggability.
- 2: optimize for fast execution without blowing up compile time or code size.
- 3: optimize for fast execution, full stop.
That’s the theory. Let’s look at what actually comes out the other end.
Reading the assembly: O0 vs O1#
At -O0 the generated code for my compute_forces function is exactly what you’d expect: every little thing is spelled out, nothing is reused, and glm operators are real function calls. Here’s a representative chunk, computing the distance between two particles:
lea     rax, [rbp-0x40]
mov     rsi, rcx
mov     rdi, rax
call    glm::operator-<double, 0>
lea     rax, [rbp-0x40]
mov     rdi, rax
call    glm::length<3, double, 0>
movq    rax, xmm0
mov     qword [rbp-0x178 {r}], rax
movsd   xmm0 {h}, qword [rbp-0x1c0]
comisd  xmm0, qword [rbp-0x178 {r}]
Two function calls just to subtract two vectors and take a length. Now the same logic at -O1:
movsd   xmm1, qword [rbx+0x10]
subsd   xmm1, qword [r12+0x10]
movsd   xmm0, qword [rbx+0x8]
subsd   xmm0, qword [r12+0x8]
movsd   xmm2, qword [rbx]
subsd   xmm2, qword [r12]
mulsd   xmm0, xmm0
mulsd   xmm2, xmm2
addsd   xmm0, xmm2
mulsd   xmm1, xmm1
addsd   xmm0, xmm1
sqrtsd  xmm0, xmm0
movsd   xmm3 {smoothing_radius}, qword [rsp]
comisd  xmm3, xmm0
A few notable things happened.
Inlining#
The glm::operator- and glm::length calls are gone. The compiler pulled their bodies straight into the loop, so now it’s just subtractions, multiplications, an add, and a sqrtsd
A call is not free. You set up arguments, jump somewhere, come back. It impacts the instruction-cache and the pipeline. Inlining gets rid of all of that. The tradeoff is that the binary gets bigger, since the body is now duplicated everywhere it was called.
Range-for lowered to pointer arithmetic#
At -O0, my for (auto& p : particles) loop is taken very literally. The compiler materializes __for_range, __for_begin and __for_end as actual stack slots and calls begin() and end():
call    std::vector<sph::Particle>::begin
mov     qword [rbp-0x1e0 {__for_begin}], rax
call    std::vector<sph::Particle>::end
mov     qword [rbp-0x1d8 {__for_end}], rax
At -O1 all of that disappears. It just loads _M_start and _M_finish straight out of the vector, walks the current particle pointer in a register, and bumps it by the size of one Particle each iteration:
add     r12, 0x58
cmp     qword [rsp+0x78], r12
This is getting close to the classic C array loop. The abstraction is still there in the source, it just costs nothing at runtime.
No autovectorization#
One thing that did not happen: vectorization.
Auto-vectorization is the compiler taking a loop you wrote as if it handles one element at a time, and rewriting it to handle several at once using the CPU’s SIMD instructions. A single addsd adds one double. The vector version addpd adds two (or four, or eight) packed side by side in one instruction. Same cost, more work done.
The loops here stayed scalar. Every operation is the single-element form. I’ll come back to why in a later part, because it turns out the data layout is fighting the compiler here.
O2 and O3#
It changes the assembly quite a lot, and I’ll admit I can’t read every line of it. But here’s what I could pick out.
At -O2, the accumulators live in registers for the whole inner loop. At -O1 the six force components (pressure_force.x/y/z and viscous_force.x/y/z) sat in fixed stack slots and got reloaded and stored on every single iteration. At -O2 they’re held in registers across the entire loop and only touch memory when they really have to. So the inner loop becomes mostly register-to-register mulsd/divsd/addsd with very little stack traffic.
The other thing: the vector reallocation path moved out of the way. At -O1, the push_back growth machinery (the size check, operator new, memcpy, operator delete) was inlined right in the middle of the gather loop. At -O2 the hot path shrinks to “append the pointer, bump the cursor, loop”, and the whole realloc sequence gets relocated to a cold block at the bottom, only reached when the buffer is actually full. It doesn’t change when allocations happen, but it keeps the common case tight.
And -O3? Nothing interesting here. Autovectorization didn’t trigger (as we saw, these loops don’t vectorize), and there was no loop worth unrolling. So it lands right next to -O2.
Performance#
| Level | Frame 0 (cold) | Steady-state (~frame 90-270) | Avg over 300 frames | Speedup vs O0 |
|---|---|---|---|---|
| O0 | 1719.47 ms | ~750-790 ms | 778.51 ms | 1.0x (baseline) |
| O1 | 135.35 ms | ~42 ms | 45.13 ms | 17.3x |
| O2 | 120.82 ms | ~39 ms | 43.90 ms | 17.7x |
| O3 | 124.03 ms | ~40 ms | 44.22 ms | 17.6x |
This lines up with what the assembly told us. Most of the win comes from the jump to -O1, and the rest is small. Still, going 17x faster without touching the code is a goodwork.
Debug mode#
There’s a flag in Meson (and in clang) that controls whether debugging is enabled, meaning debug symbols get included. Surely that makes a big difference, right?
| Run | Frame 0 (cold) | Avg over 300 frames | Speedup vs O0 |
|---|---|---|---|
| O3, debug=true | 124.03 ms | 44.22 ms | 17.6x |
| O3, debug=false | 135.65 ms | 46.51 ms | 16.7x |
I’m kidding. It doesn’t. The difference here is noise. Debug symbols sit in the binary; they don’t slow down the code that runs.
The flag sweep#
-O3 is the obvious lever, but clang has a whole pile of other optimization flags. So I did what any soft eng would do: I brute-forced about 1025 flag combinations, ran each one (best of 3, 300 particles over 300 frames), and sorted them by milliseconds per step. Speedup is relative to the -O0 baseline at 47.91 ms/step.
Of course. I asked Claude to write a python script to automate all of it
Here’s the top of the list, plus the plain -O3 and -O0 rows for reference:
  rank    best ms    mean ms   speedup  flags
  ----------------------------------------------------------------------------------------
     1       1.21       1.23    39.60x  -O3 -march=native -ffast-math -funroll-loops -ffp-contract=fast -fno-stack-protector
     2       1.21       1.24    39.60x  -O3 -march=native -ffast-math -funroll-loops -fno-math-errno -fomit-frame-pointer
     3       1.22       1.28    39.27x  -O3 -march=native -ffast-math -fno-plt -fno-stack-protector
     4       1.22       1.26    39.27x  -O3 -march=native -ffast-math -funroll-loops -ffp-contract=fast -fno-math-errno
     5       1.22       1.24    39.27x  -O3 -march=native -ffast-math -funroll-loops -fno-math-errno -fno-semantic-interposition
   ...
   147       1.26       1.27    38.02x  -O3 -march=native -ffast-math
   ...
   945       2.44       2.45    19.64x  -O3 (base)
   ...
  1025      47.91      47.99     1.00x  -O0 (baseline)
The shape of this is the interesting bit. Plain -O3 gets you to about 19.6x. The whole top of the table sits around 39x. That extra near-doubling comes from two flags, and basically two flags only: -march=native and -ffast-math. Notice that rank 147, which is just -O3 -march=native -ffast-math with nothing else, already hits 38x. Everything stacked on top of it is rounding error.
So what do all these flags actually do? roughly in order of how much they mattered here.
The two that carried the result:
-march=native: build specifically for the CPU you’re compiling on, instead of a generic baseline. This unlocks newer instruction sets your chip actually has (AVX, FMA, and friends). Big win.-ffast-math: lets the compiler relax the strict IEEE floating-point rules. It can reassociate operations, assume there are no NaNs or infinities, and generally rearrange and fuse your math in ways the standard normally forbids.
The ones that did almost nothing on this workload:
-ffp-contract=fast: allow fusing a multiply followed by an add into a single FMA instruction. Mostly already covered by-ffast-math.-fno-math-errno: stop math functions likesqrtandpowfrom settingerrno, so the compiler can treat them as pure and optimize around them more aggressively.-funroll-loops: emit several iterations of a loop body per pass to cut loop overhead. Did little here, because there wasn’t much worth unrolling.-flto: link-time optimization, which lets the optimizer see across separate source files. Negligible when most of the cpu time is in one loop in one file.-fomit-frame-pointer: drop the frame pointer sorbpbecomes a free general-purpose register.-fno-pltand-fno-semantic-interposition: make calls into shared libraries cheaper and more direct.-fno-stack-protector: remove the stack canary checks. Tiny, and you’re giving up a safety feature
-ffast-math and -fno-stack-protector are not free. -ffast-math changes the actual results of your floating-point math, so if you care about reproducibility or edge cases like NaN handling, measure before you trust it. -fno-stack-protector removes a real security mitigation. MAKE SURE TO KNOW WHAT YOU ARE DOING !!!Wrap-up#
So that’s the cheap part done. Without rewriting a single line of the algorithm, the right compiler flags took me from the -O0 baseline to roughly 40x faster. Most of that is just -O3 -march=native -ffast-math.
But the compiler can only do so much with the code I gave it. It refused to vectorize my loops, the data is scattered across the heap, and the neighbour search is doing far more work than it needs to. That’s where the next part goes: making the code itself fast.